Process Monitor
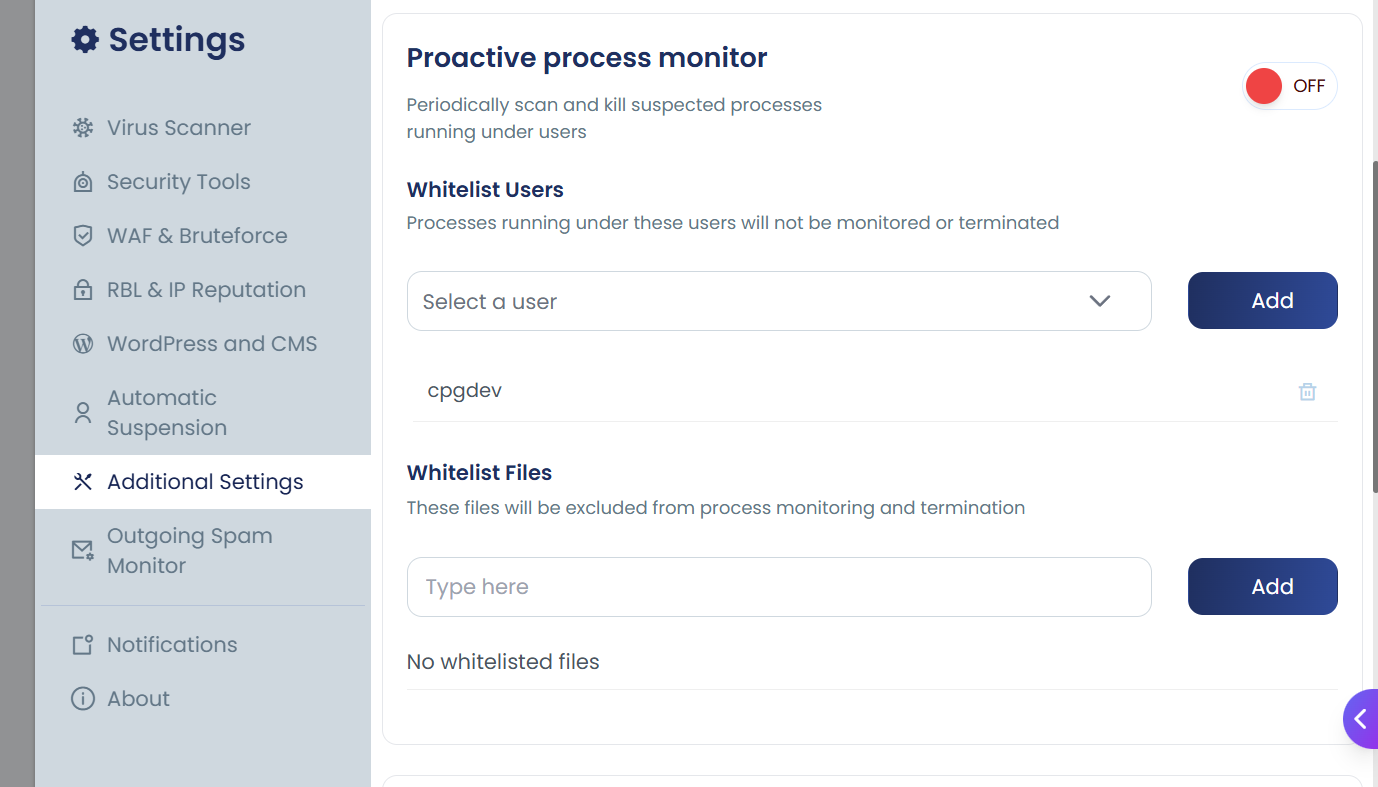
The Proactive Process Monitor periodically scans and kills suspected processes running under users on the server.
You can enable or disable this feature from: Settings > Additional Settings > Proactive Process Monitor
Should You Be Worried?
No. In most cases, suspicious processes are already terminated automatically if you have enabled suspicious process tracking in the settings. You may safely ignore this alert, as the process was already killed.
Note: It's not PHP itself that is infected — rather, a PHP script triggered suspicious behavior, which raised this alert.
Enable / Disable
# Enable Process Monitor
cpgcli process-monitor --enable

# Disable Process Monitor
cpgcli process-monitor --disable
Whitelist Users
Processes running under whitelisted users will not be monitored or terminated.
# List all whitelisted users
cpgcli process-monitor --whitelist-users --list

# Add a user to the whitelist
cpgcli process-monitor --whitelist-users --add cpgdev

# Remove a user from the whitelist
cpgcli process-monitor --whitelist-users --remove cpgdev
Whitelist Files / Processes
Specific files or processes can be excluded from monitoring by whitelisting their path or command line string. Any process whose path or command line contains the whitelisted string will be skipped.
# List all whitelisted process identifiers
cpgcli process-monitor --whitelist --list

# Add a process path or command line string to the whitelist
cpgcli process-monitor --whitelist --add /usr/bin/example

# Remove a process path or command line string from the whitelist
cpgcli process-monitor --whitelist --remove /usr/bin/example
How to View More Details
To get more information about the alert, follow these steps in your dashboard:
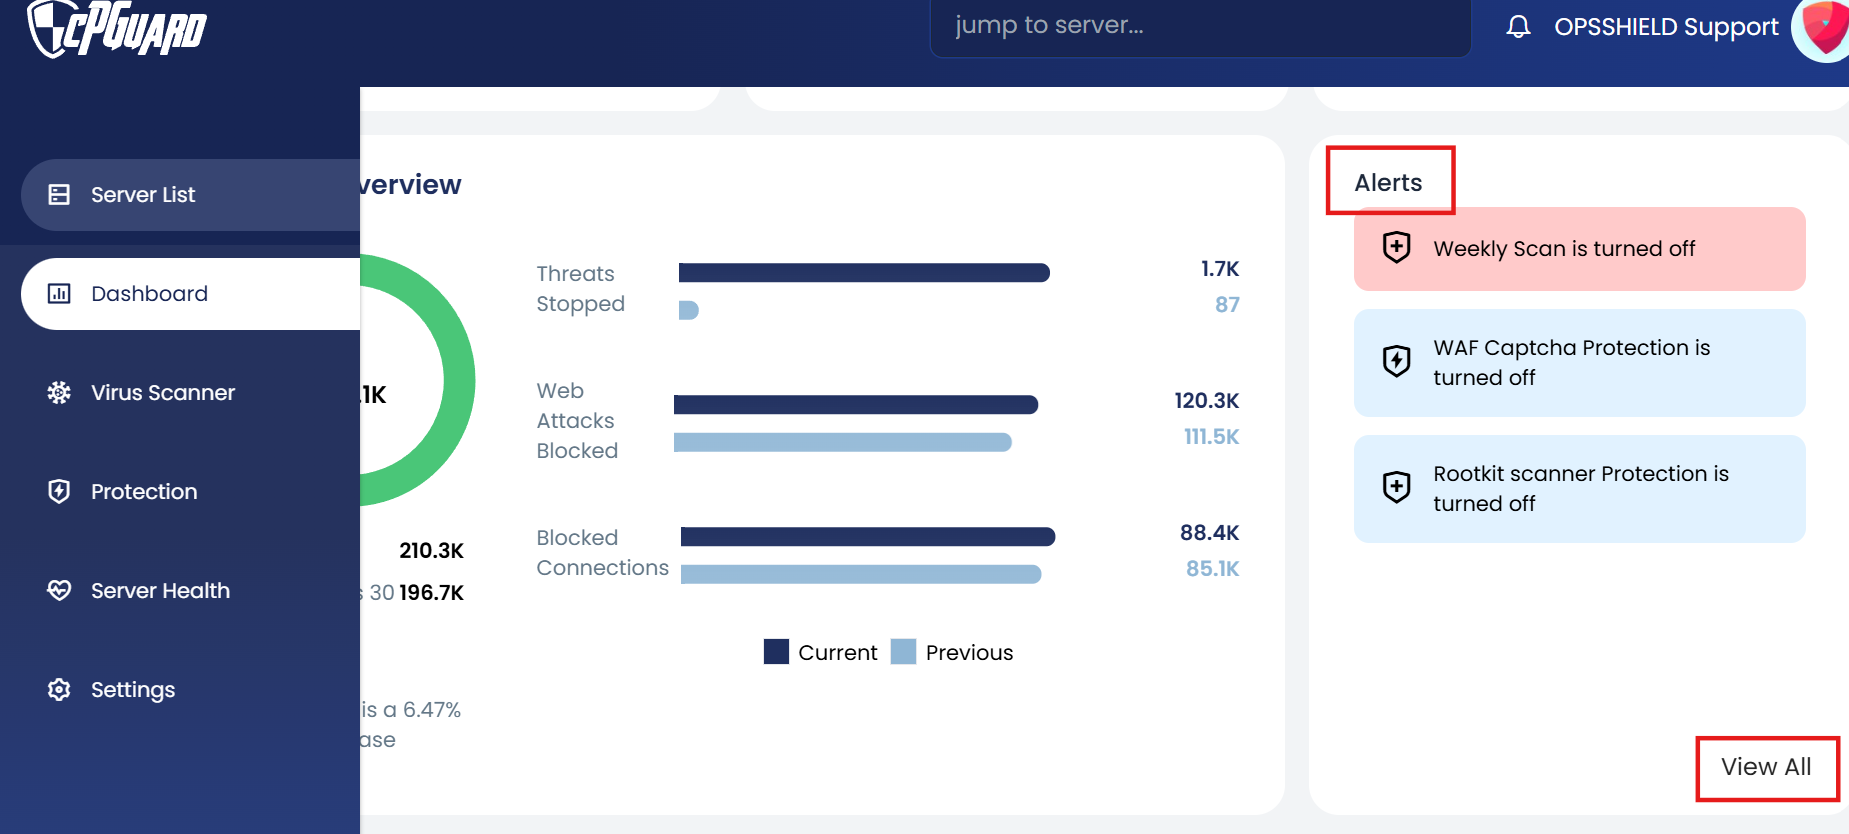
- Go to the Alerts section
- Click View All
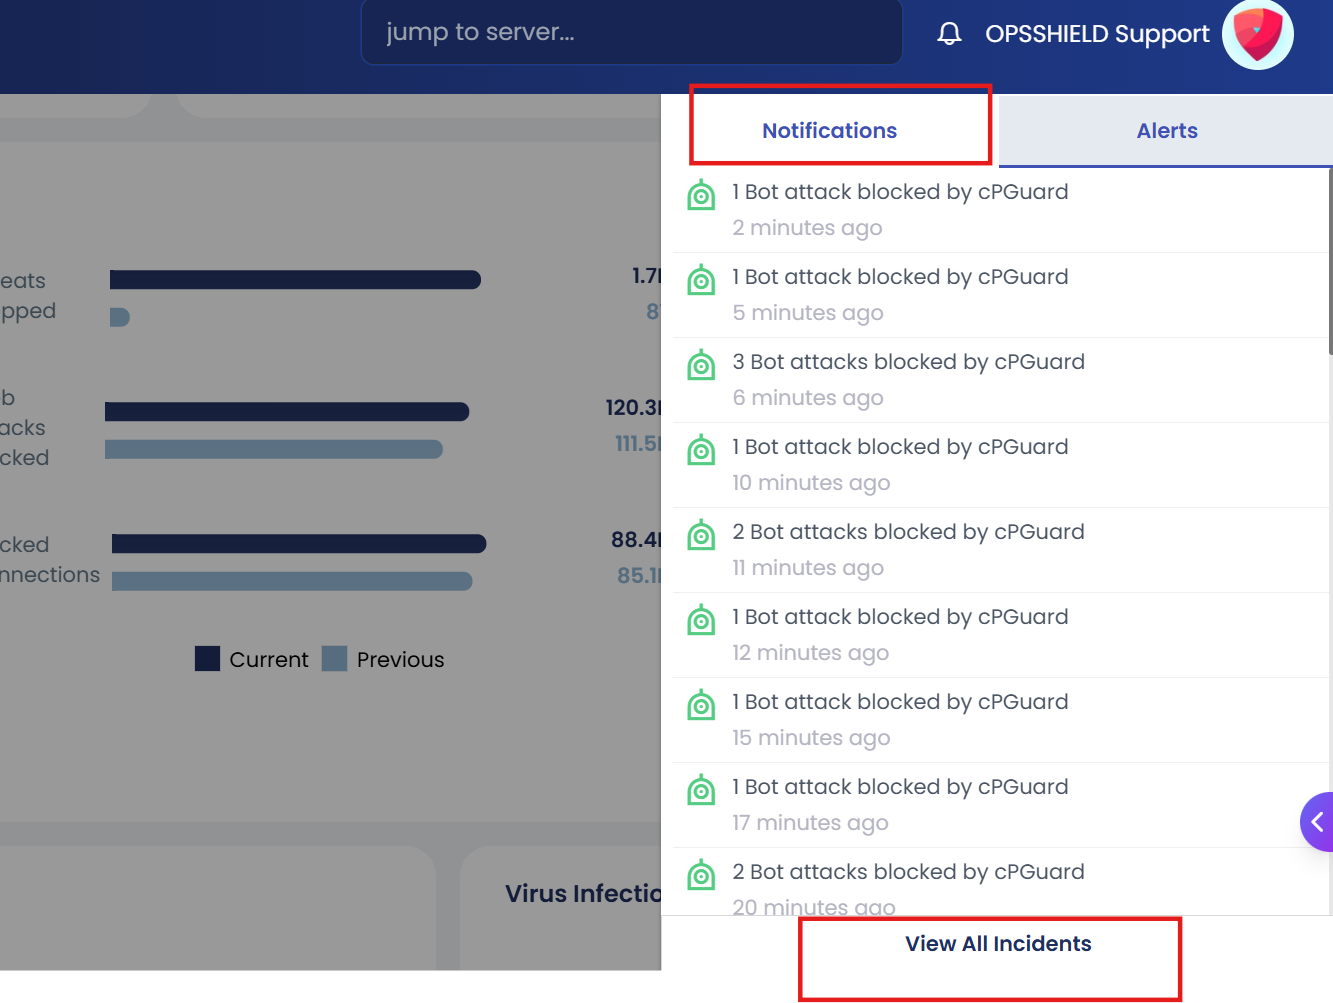
- Click on Notifications
- Select View Incidents
- You will see the related alert: Suspicious Process Detected and Killed
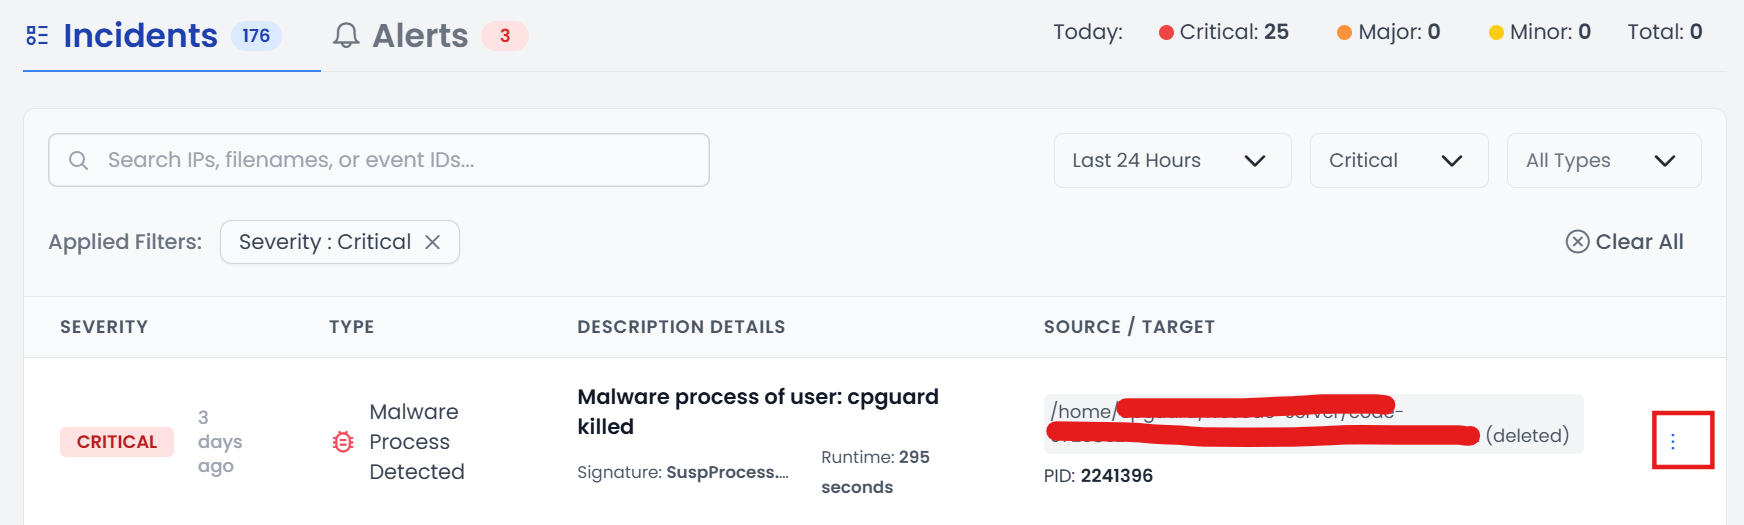
- Click the three dots (⋮) next to the incident to view full details
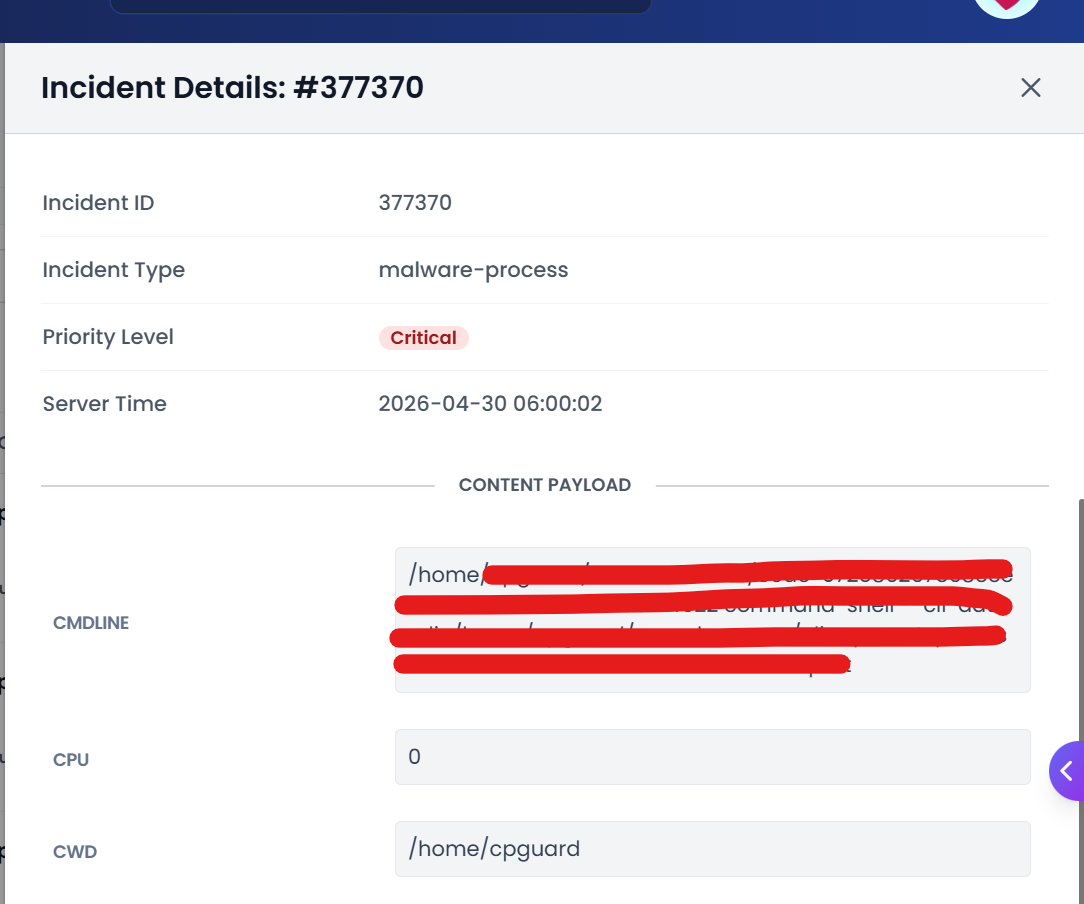
Incident Details Explained
When you open an incident, you will see the following fields:
| Field | Description |
|---|---|
| Incident ID | Unique identifier for the alert |
| Incident Type | Type of threat detected (e.g., malware-process) |
| Priority Level | Severity of the alert (e.g., Critical) |
| Server Time | Date and time the incident was detected |
| Content Payload | Raw details of the flagged process |
| CMDLINE | The exact command that was running when the process was flagged |
| CPU | CPU usage of the process at the time of detection |
| CWD | Current working directory where the process was running |
This alert is informational. Your security system detected and terminated the process automatically. No further action is required unless the same alert keeps recurring.